Spectrogram and Bar Graph Analysis
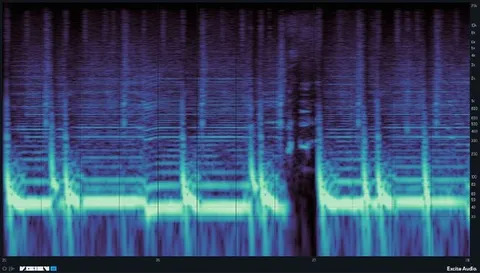
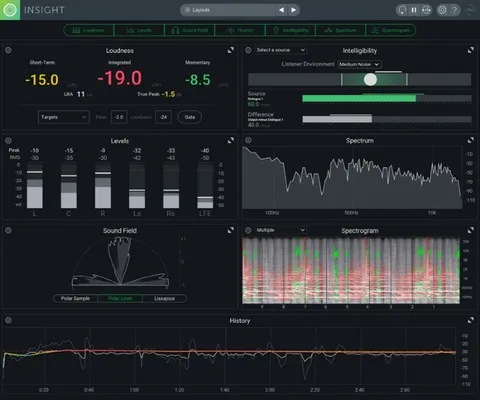
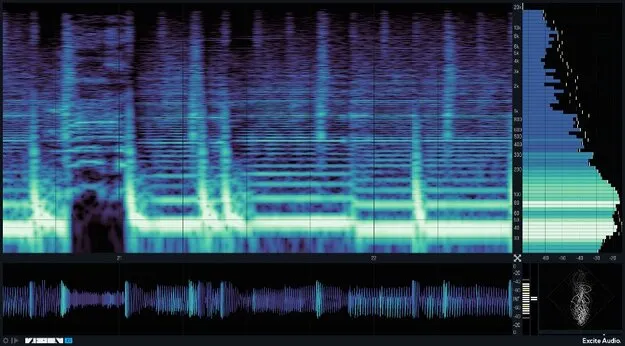
The spectrogram offers enhanced low-end resolution and can be frozen or zoomed to examine specific areas of the frequency spectrum. Ten colour maps are available, and a Map Curve/Tone Bias control shifts brightness toward low or high frequencies.
The bar graph is a customisable spectrum analyser with adjustable bar count, speed and peak hold. A Spectrum Highlight feature flags resonant frequencies, and the display can be compared against reference curves for different genres. Overshooting is shown in red, and you can capture your own reference curves from other tracks.