Spectrogram and Bar Graph for Frequency Balance
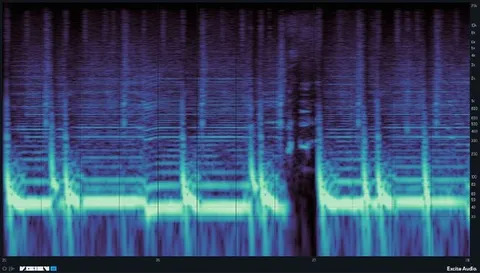
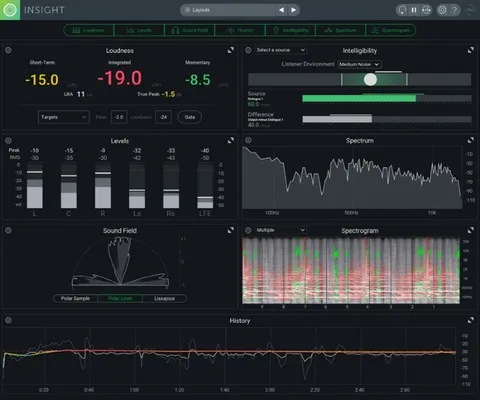
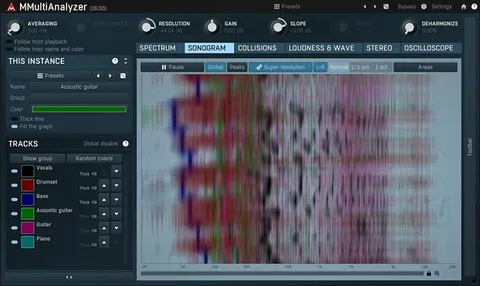
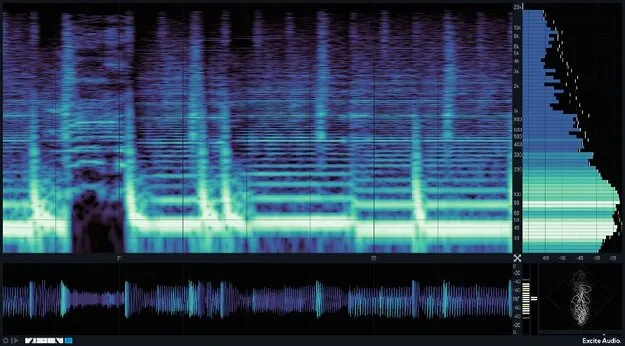
The spectrogram is designed with enhanced low-end resolution, so you can see more detail in the bass region of your mix. You can freeze the display, zoom into the frequency spectrum, and scroll to inspect areas of interest. Three visualisation modes cover transient, harmonic and all-round analysis, and ten colour maps let you adjust the display. Map Bias shifts brightness toward low or high frequencies, while the Range Hz and Range dB controls set the frequency and level window.
The bar graph works as a customisable spectrum analyser. You can change the number of bars from four up to a line graph, adjust the speed of movement, and use Peak Hold to track peak levels. Reference curves from a range of genres are included, each with average and maximum lines, and you can capture your own reference curves from tracks you admire.