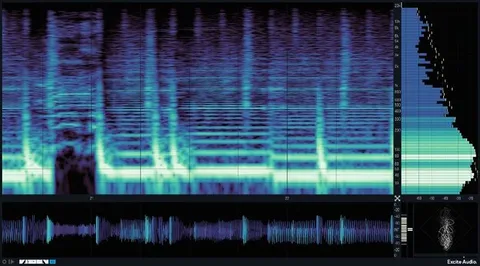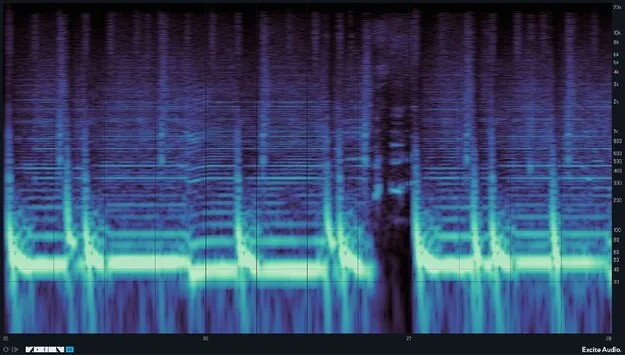
Real-Time Spectrogram Display
The analyser shows your audio as a high-definition spectrogram. Freeze and zoom functions let you capture a snapshot of a sound and examine a narrower part of the frequency spectrum. The Freeze Display and Zoom-In features support closer inspection of details that might otherwise be missed.
Customisable Frequency Range and dB Range controls set the scope of the display. Map Curve or Tone Bias focuses the colour map on specific frequencies, and ten colour maps are available, each chosen for information density.