Spectrum Analysis and Measurement Tools
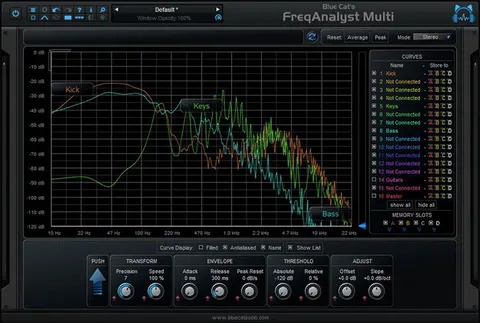
The analyzer runs in mono, stereo or mid/side modes. Each channel can show instant, peak or average curves on the same graph, and you can store up to four curves in memory to compare tracks or effect setups side by side.
Zooming is animated across all displays, and coordinate readouts let you measure the spectrum precisely, including a note information display. Two threshold systems, absolute and relative, help you define what counts as signal in the analysis.
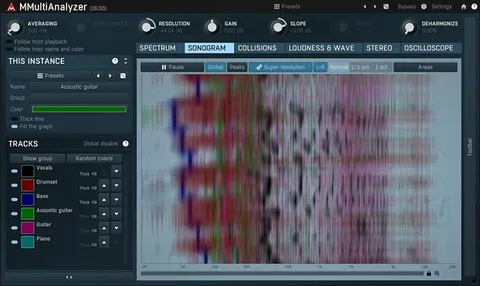
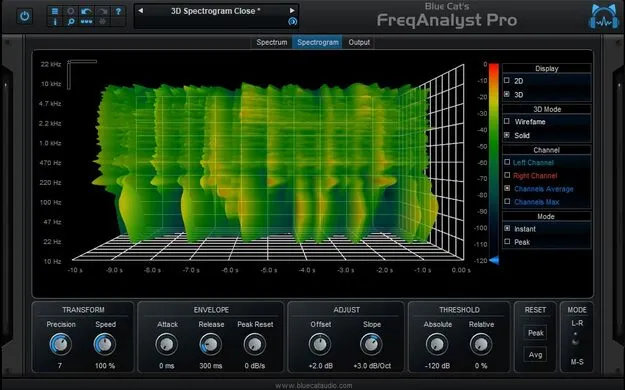
A spectrogram view shows how the spectrum changes over time, in 2D or as a 3D waterfall with full 3D control and a solid or wireframe surface option.